???? ginprom
Prometheus metrics exporter for Gin.Inspired by Depado/ginprom.
项目地址:https://github.com/chenjiandongx/ginprom
???? Installation
$ go get -u github.com/chenjiandongx/ginprom
???? Usage
It's easy to get started with ginprom, only a few lines of code needed.
import (
	"github.com/chenjiandongx/ginprom"
	"github.com/gin-gonic/gin"
	"github.com/prometheus/client_golang/prometheus/promhttp"
)

func main() {
    r := gin.Default()
    // use prometheus metrics exporter middleware.
	r.Use(ginprom.PromMiddleware())

    // register the `/metrices` route.
	r.GET("/metrics", ginprom.PromHandler(promhttp.Handler()))

    // your working routes
	r.GET("/", func(c *gin.Context) {
		c.JSON(http.StatusOK, gin.H{"message": "home"})
    })
}
???? Metrics
Details about exposed Prometheus metrics.
| Name                                  | Type      | Description                         |
| service_http_request_count_total      | Counter   | Total number of HTTP requests made. |
| service_http_request_duration_seconds | Histogram | HTTP request latencies in seconds.  |
| service_http_request_size_bytes       | Summary   | HTTP request sizes in bytes.        |
| service_http_response_size_bytes      | Summary   | HTTP request sizes in bytes.        |
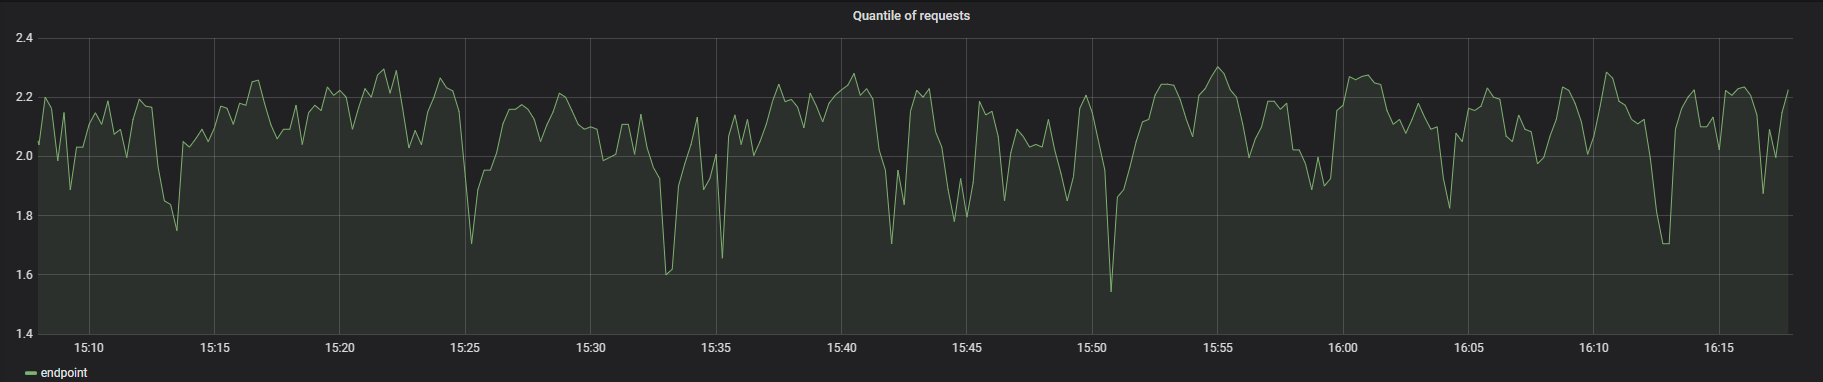
???? Grafana
Although Promethues offers a simple dashboard, Grafana is clearly a better choice. Grafana configuration.

有疑问加站长微信联系(非本文作者)