chart 是一个非常简单的 golang 原生图表库,支持 timeseries 和连续线图表。
## 安装
```bash
> go get -u github.com/wcharczuk/go-chart
```
# Examples
Spark Lines:
![](https://raw.githubusercontent.com/wcharczuk/go-chart/master/_images/tvix_ltm.png)
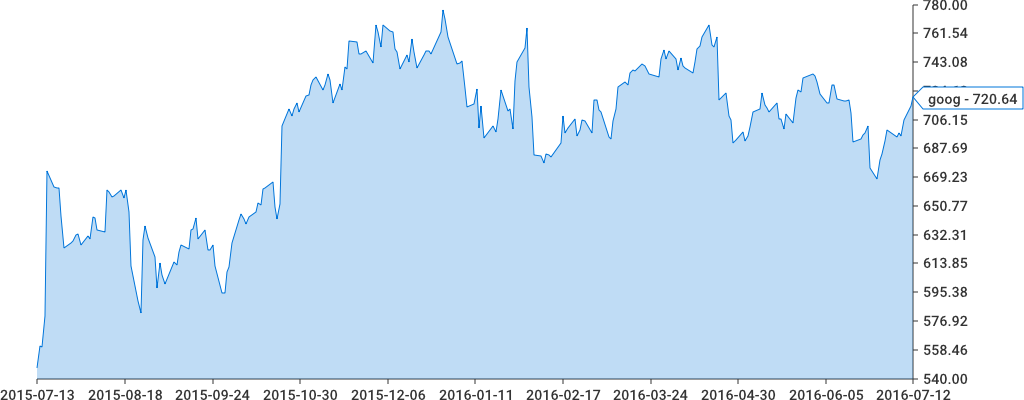
Single axis:
![](https://raw.githubusercontent.com/wcharczuk/go-chart/master/_images/goog_ltm.png)
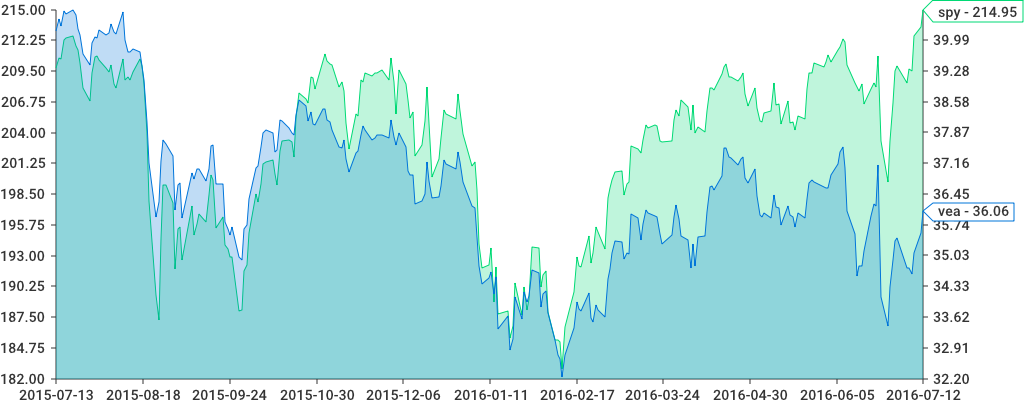
Two axis:
![](https://raw.githubusercontent.com/wcharczuk/go-chart/master/_images/two_axis.png)
# Other Chart Types
Pie Chart:
![](https://raw.githubusercontent.com/wcharczuk/go-chart/master/_images/pie_chart.png)
The code for this chart can be found in `_examples/pie_chart/main.go`.
Stacked Bar:
![](https://raw.githubusercontent.com/wcharczuk/go-chart/master/_images/stacked_bar.png)
The code for this chart can be found in `_examples/stacked_bar/main.go`.