前两天介绍了一款 Go 语言绘图工具:go-chart。今天发现了另外一款类似的工具,但更强大。不过还没发布稳定版。
项目地址:https://github.com/gonum/plot,Star 数 1.4k
简介
gonum/plot 是 code.google.com/p/plotinum 的新官方分支。它提供了用于在 Go 中构建和绘制图的 API。请注意,此新API 仍在不断变化中,并且可能会发生变化。
gonum/plot 分为几个子包:
- plot 包提供了用于布局图的简单界面,并提供了用于绘制图的基本元素;
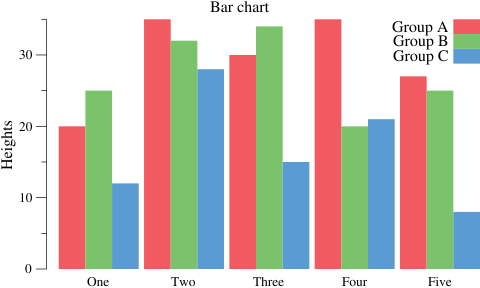
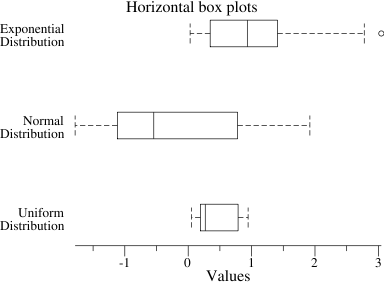
- plotter 包提供了一组标准的绘图仪,这些绘图仪使用 plot 软件包提供的基本元素绘制直线图,散点图,箱形图,误差线等;
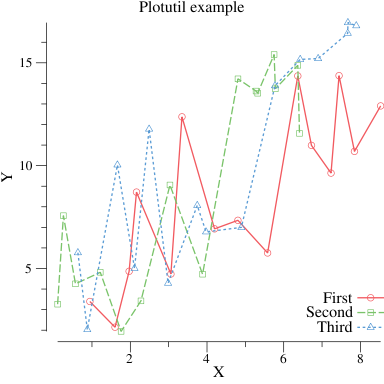
- plotutil 包包含一些例程,可以很容易地制作一些常见的绘图类型。这个包是很新的,因此它没有像其他包那样经过良好的测试,并且势必会发生变化;
- vg 包提供了通用矢量图形 API,该 API 位于其他矢量图形后端(例如自定义 EPS 后端,draw2d,SVGo,X-Window和 gopdf)的顶部;
安装
go get gonum.org/v1/plot/...
文档
https://godoc.org/gonum.org/v1/plot
示例图表


有疑问加站长微信联系(非本文作者)


