我以前觉得使用 goroutine 和 channel 的性能开销是基本忽略不计的--尤其是和 IO 的性能开销相比--但是最近我做了一个实验,实际验证了下。
我在给我的课程项目做一个玩具相关的数据库。一开始,我从 CSV 文件里加载数据表,后来我需要添加一个二进制的表格结构。不幸的是,第一次尝试(加载二进制表格)的效果比加载 CSV 文件差远了。
$ ./csv_scan_benchmark -path table.csv
Done scanning 20000263 records after 15.69807191s
$ ./binary_scan_benchmark -path table.bt
Done scanning 20000263 records after 27.01220384s
扫描二进制表格的时间慢了两倍!这也太反常了,因为二进制表格结构更简单,不需要字符串转换。 幸好,我用了几个不错的 go 的性能测试工具研究了一下这个问题。
扫描 CSV 表格的 CPU profile 看起来比较合理,大部分时间浪费在 IO 相关的系统调用上;
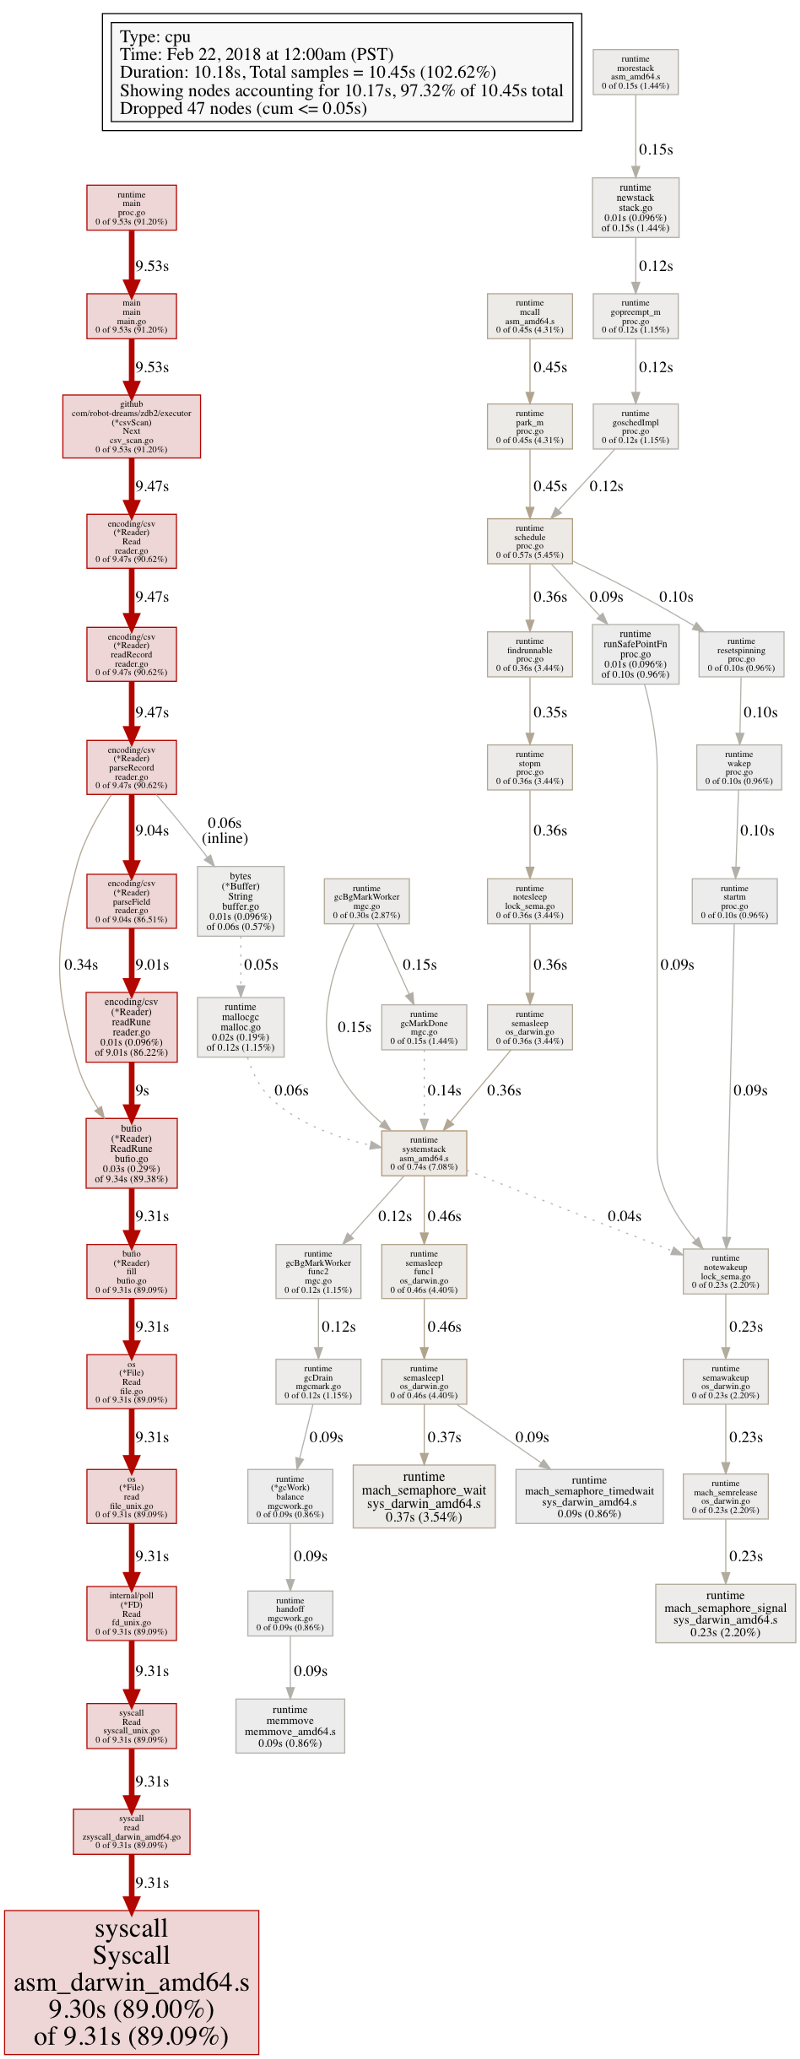
扫描 CSV 表格的 CPU profile
但是扫描二进制表格的 CPU profile 看起来一点都不合理;只有很少一部分时间花在 IO 上。
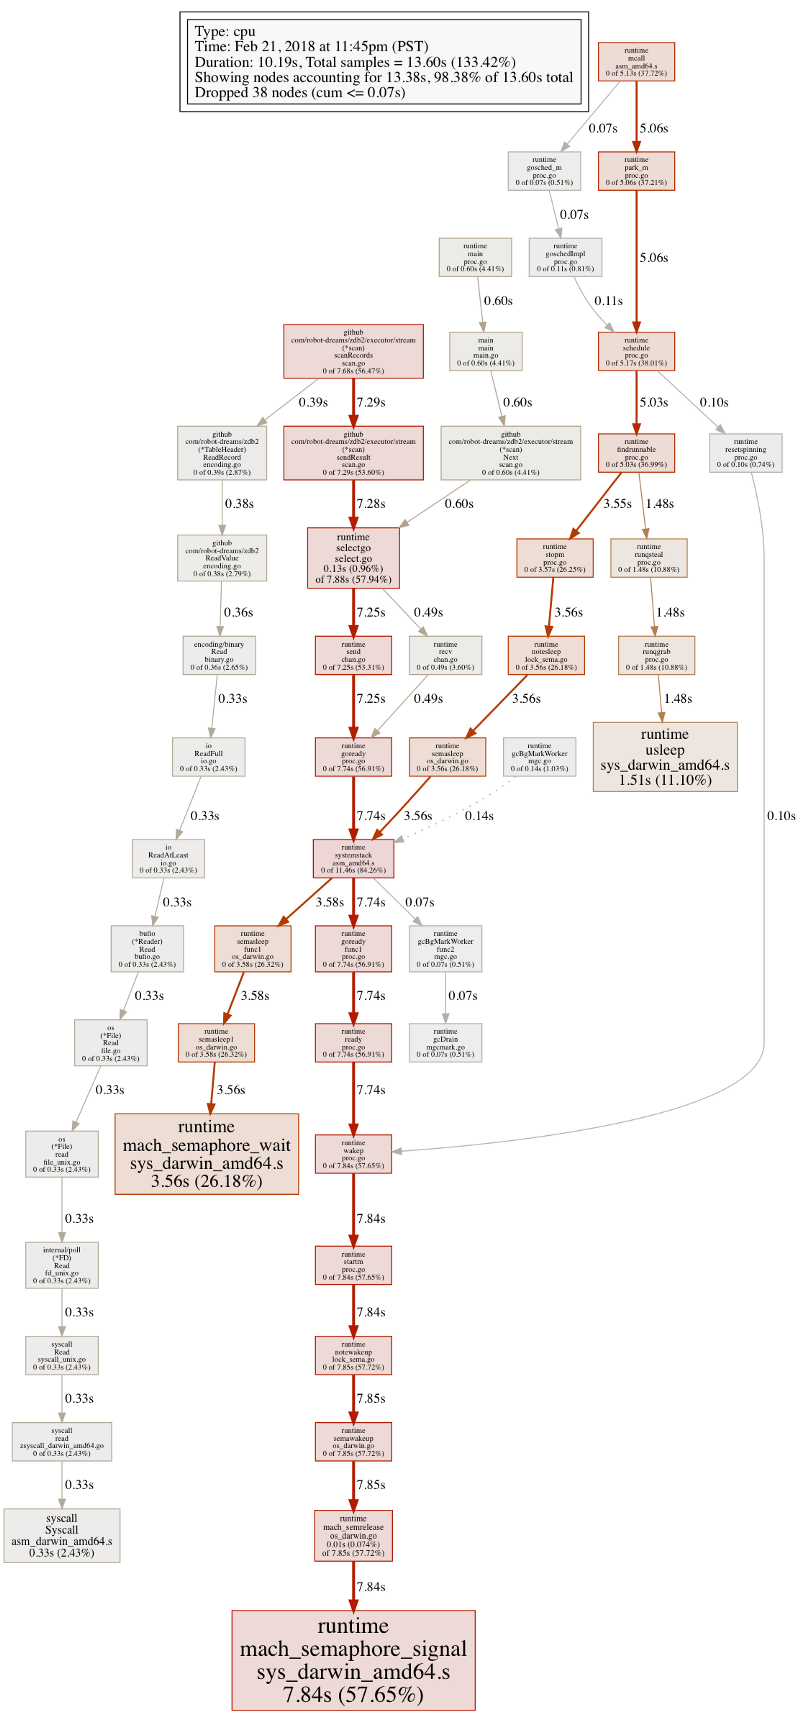
扫描二进制表格的 CPU profile(第一次实验结果)
原来,这个不合理的 CPU profile ,是由于我使用了 go 的并发原型。 当时我想用 goroutine 和 channel 把生产者和消费者解耦,简化 scanner 的代码结构。
创建 scanner 启动生产者 goroutine,用来实现 IO 操作/解码,给 channel 返回结果:
func NewBinaryScan(path string) (*binaryScan, error) {
    ...
    go s.producer()
    return s, nil
}
func (s *binaryScan) producer() {
    for {
        record, err = s.readAndDecodeRecord(s.bufferedReader)
        s.resultChan <- &result{record, err}
        if err != nil {
            return
        }
    }
}
消费者 goroutine,通过重复调用 NextRecord 获取结果,只需从 result channel 中读数据:
func (s *binaryScan) NextRecord() (Record, error) {
    result := <-s.resultChan:
    return result.record, result.err
}
可是,从 CPU profile 看出,在这一步,goroutine 花了大量时间阻塞在 channel 操作上,go 在运行时浪费了大量资源在调度/并发原型上。
我重写了二进制表格扫描代码片段,直接在消费者 goroutine 上做了所有操作:
func NewBinaryScan(path string) (*binaryScan, error) {
    ...
    // No more producer.
    return s, nil
}
func (s *binaryScan) NextRecord() (Record, error) {
    return s.readAndDecodeRecord(s.bufferedReader)
}
不过,这个小改动在性能上却有非常大的影响。下面是更新后的 CPU profile,看起来比之前更合理:
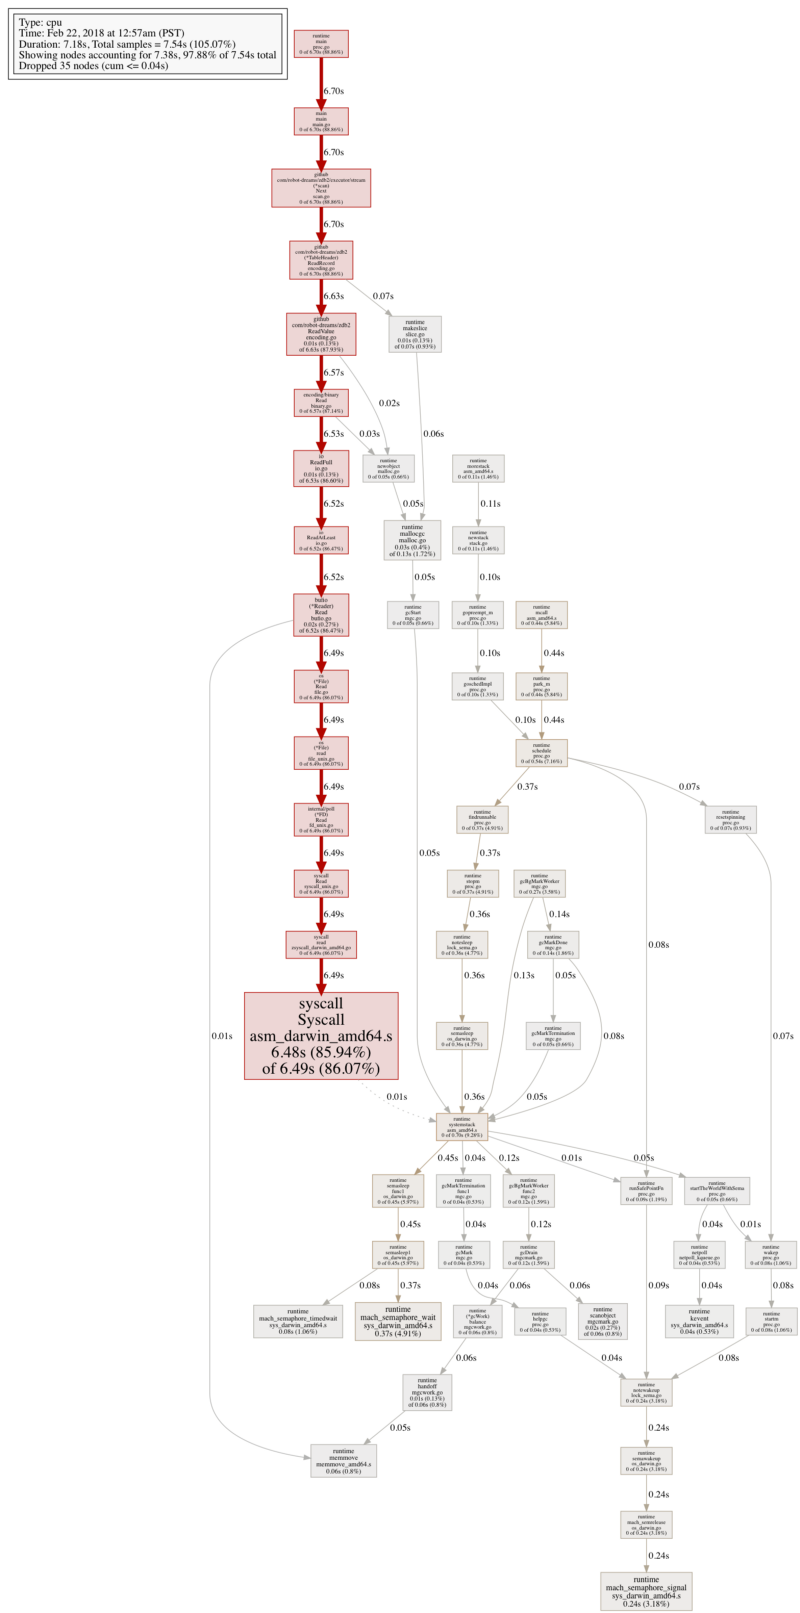
扫描二进制表格的 CPU profile (改进后)
下面是更新后的 benchmark 结果:
$ ./binary_scan_benchmark -path ratings.bt
Done scanning 20000263 records after 8.160765247s
比读取 CSV 文件快 2 倍多,比第一次实验快 3 倍多,这还差不多!
我一直以为合理的使用 goroutine 和 channel 可以使代码简洁,在大部分情况下,不可能是性能问题的根本原因。但是这次实验给我提了个醒,就是 go 的超级并发模型不能随便滥用。
[校订]
感谢 Raghav 的建议,他提供了更多 benchmark 的测试实例!
- 在
select添加context.Context,减少 producer 超时时间: 59.4s - 在
select添加context.Context,减少 consumer 超时时间: 58.0s - 使用缓冲为 1 的 channel :23.5s
- 使用缓冲为 1000 的 channel :17.4s
- 在
donechannel 中去掉select(donechannel 不在上述代码片段里):19.9s - 在
donechannel 去掉select,同时使用缓冲为 1000 的 channel:14.3s
看来我们又学到一点:channel 缓冲大小和 select 语句的复杂度都对性能都有很大影响。
[校对2]
感谢 Stuart Carnie 的建议,他建议通过 channel 同时发送批次记录,而不是一次只发送一条!下面是我使用不同的批次大小得到的 benchmark 结果:
- 1: 28.83s
- 10: 12.36s
- 100: 8.92s
- 1,000: 8.68s
- 10,000: 8.74s
- 100,000: 9.32s
看来,正如 Stuart 所说,将 channel 写操作的个数减少 3 个数量级,在此处同样产生很大影响。
via: https://medium.com/@robot_dreams/goroutines-and-channels-arent-free-a8684f3b6560
作者:Elliott Jin 译者:ArisAries 校对:polaris1119
本文由 GCTT 原创翻译,Go语言中文网 首发。也想加入译者行列,为开源做一些自己的贡献么?欢迎加入 GCTT!
翻译工作和译文发表仅用于学习和交流目的,翻译工作遵照 CC-BY-NC-SA 协议规定,如果我们的工作有侵犯到您的权益,请及时联系我们。
欢迎遵照 CC-BY-NC-SA 协议规定 转载,敬请在正文中标注并保留原文/译文链接和作者/译者等信息。
文章仅代表作者的知识和看法,如有不同观点,请楼下排队吐槽
有疑问加站长微信联系(非本文作者))