监测服务级别的指标能让团队成员更清晰的看到你的程序表现如何,你的程序如何被使用,并且可以帮助定位潜在的性能瓶颈。
Prometheus 是一个开源的监测解决方案,原生的服务发现支持让它成为动态环境下进行服务监测的一个完美选择。Prometheus 支持从 AWS, Kubernetes, Consul 等 拉取服务 !
当使用 Prometheus 生成服务级别的指标时,有两个典型的方法:内嵌地运行在一个服务里并在 HTTP 服务器上暴露一个 /metrics 端点,或者创建一个独立运行的进程,建立一个所谓的导出器。
在这篇指南里,我们从头到尾过一遍如何使用官方的 Golang 客户端在基于 Go 的服务中集成 Prometheus。查阅这个关于 向一个基于 worker 的 Go 服务添加指标 的完整示例。
开始使用
Prometheus 程序库 提供了一个用 Golang 写成的健壮的插桩库,可以用来注册,收集和暴露服务的指标。在讲述如何在应用程序中暴露指标前,让我们先来探究一下 Prometheus 库提供的各种指标类型。
指标类型
Prometheus 客户端公开了在暴露服务指标时能够运用的四种指标类型。查看 Prometheus 的文档 以获得关于各种指标类型的深入信息。
Counter(计数器)
counter 是一个累计的指标,代表一个单调递增的计数器,它的值只会增加或在重启时重置为零。例如,你可以使用 counter 来代表服务过的请求数,完成的任务数,或者错误的次数。
Gauge(计量器)
gauge 是代表一个数值类型的指标,它的值可以增或减。gauge 通常用于一些度量的值例如温度或是当前内存使用,也可以用于一些可以增减的“计数”,如正在运行的 Goroutine 个数。
Histogram(分布图)
histogram 对观测值(类似请求延迟或回复包大小)进行采样,并用一些可配置的桶来计数。它也会给出一个所有观测值的总和。
Summary(摘要)
跟 histogram 类似,summary 也对观测值(类似请求延迟或回复包大小)进行采样。同时它会给出一个总数以及所有观测值的总和,它在一个滑动的时间窗口上计算可配置的分位数。
Prometheus HTTP 服务器
在你的服务中集成 prometheus 的第一步就是初始化一个 HTTP 服务器用来提供 Prometheus 的指标。这个服务器应该监听一个只在你的基础设施内可用的内部端口;通常是在 9xxx 范围内。Prometheus 团队维护一个 默认端口分配 的列表,当你选择端口时可以参考。
// create a new mux server
server := http.NewServeMux()
// register a new handler for the /metrics endpoint
server.Handle("/metrics", promhttp.Handler())
// start an http server using the mux server
http.ListenAndServe(":9001", server)
这将创建一个新的 HTTP 服务器运行在端口 :9001 上,它将暴露 Prometheus 预期格式的指标。在启动了 HTTP 服务器后,尝试运行 curl localhost:9001/metrics. 你将看到如下格式的指标。
# HELP Go_goroutines Number of Goroutines that currently exist.
# TYPE Go_goroutines gauge
go_goroutines 5
对外暴露服务指标
针对这个例子,我们将把 prometheus 统计数据 添加到一个处理后台任务的队列系统。为了模拟执行时间各不相同的任务,每个任务将 sleep 一个随机时间。每个 worker 都配置为对它处理的每个任务打印一行日志。
func main() {
  ...
  // create a channel with a 10,000 Job buffer
  jobChannel := make(chan *Job, 10000)
  // start the job processor
  Go startJobProcessor(jobChannel)
  // start a Goroutine to create some mock jobs
  Go createJobs(jobChannel)
  ...
}

// Create a new worker that will process jobs on an job channel
func startWorker(workerID string, jobs <- chan *Job) {
  for {
    select {
    // read from the job channel
    case job := <-jobs:
      log.Printf(
        "[%s] Processing job with worker %s\n",
        time.Now().String(),
        workerID,
      )
      // fake processing the request
      time.Sleep(job.Sleep)
    }
  }
}
试着执行程序并看一下你是否能够测定出正在被处理的任务数,等待处理的任务数,或是处理任务所用的时间。也试着看一下这些统计数据在历史上是什么表现。现在,显然我们可以把这些信息记录在一行日志里,把这些日志送到 ELK 集群,然后每天调用一次。但是,在指标和日志之间是存在一个折中的。
由于存储和传输成本都比较低,指标的开销往往比日志要小。所以我们如何修改我们的服务去添加 Prometheus 统计数据?需要做的第一件事就是修改我们的程序以创建我们想要采集的 Prometheus 指标。
那么让我们专注于采集三组数据点:已经处理的任务数,等待处理的任务数,以及处理一个任务的平均时间。
添加服务指标
那么首先,让我们专注于采集已被我们的 worker 处理过的任务数。这个指标也将让我们能够采集到单个 worker 处理过的任务数。当你注册了这个计数器 (counter),你将需要修改 worker 的函数以追踪处理过的任务数。
var (
  totalCounterVec = prometheus.NewCounterVec(
    prometheus.CounterOpts{
      Namespace: "worker",
      Subsystem: "jobs",
      Name: "processed_total",
      Help: "Total number of jobs processed by the workers",
    },
    // We will want to monitor the worker ID that processed the
    // job, and the type of job that was processed
    []string{"worker_id", "type"},
  )
)

func INIt() {
  ...
  // register with the prometheus collector
  prometheus.MustRegister(totalCounterVec)
  ...
}

func startWorker(workerID string, jobs <-chan *Job) {
  for {
    select {
    case job := <-jobs:
      ...
      totalCounterVec.WithLabelValues(workerID, job.Type).Inc()
      ...
    }
  }
}
当服务更新后,再次运行它并向 prometheus 端点发请求。你应该会在 prometheus 的输出中看到一个新的指标代表被给定的 worker 处理过的任务数。输出会看起来跟下面的类似。
# HELP worker_jobs_processed_total Total jobs processed by the workers
# TYPE worker_jobs_processed_total counter
worker_jobs_processed_total{type="activation",      worker_id="1"} 22
worker_jobs_processed_total{type="activation",      worker_id="2"} 16
worker_jobs_processed_total{type="customer_renew",  worker_id="1"} 1
worker_jobs_processed_total{type="deactivation",    worker_id="2"} 22
worker_jobs_processed_total{type="email",           worker_id="1"} 20
worker_jobs_processed_total{type="order_processed", worker_id="2"} 13
worker_jobs_processed_total{type="transaction",     worker_id="1"} 16
下一步,试试看你能否更新 worker 以采集正在处理的任务数 (提示 : 使用 Guage ???? ) 以及 worker 处理一个任务所花费的时间 (提示 : 使用 Histogram ???? ).
分析数据
在我们能够分析服务暴露出的指标之前,我们需要对 Prometheus 进行配置,使其能够向服务拉取指标。
设置 Prometheus
那么,现在我们已经更新了服务,能够暴露 Prometheus 指标,我们需要配置 Prometheus 使其从我们的服务拉取指标。为此,我们将创建一个新的 prometheus 抓取配置,以便从服务拉取。参阅 Prometheus 文档 获得更多关于抓取配置的信息。
scrape_configs:
  - job_name: 'demo'
    # scrape the service every second
    scrape_interval: 1s
    # setup the static configs
    static_configs:
      - targets: ['docker.for.mac.localhost:9009']
接下来,启动 Prometheus 服务器,开始采集服务暴露的指标。你应当可以使用下列 docker compose 服务配置。
services:
  prometheus:
    image: 'prom/prometheus:latest'
    ports:
    - '8080:8080'
    volumes:
    - './prometheus.yml:/etc/prometheus/prometheus.yml'
查询数据
注:参阅 查询的文档 以获取更多关于 Prometheus 查询的信息。
现在 Prometheus 从我们服务的端点抓取指标,你可以使用 Prometheus 的查询语言来生成对你的应用有意义的指标。例如,目前所有 worker 每秒处理的任务数就应该是一个很重要的指标。我们可以使用 rate() 函数来生成。下列查询将生成在 5 分钟间隔内每秒钟处理的任务数。
sum by (type) (rate(worker_jobs_processed_total[5m]))
监测任务加入队列的速度对这个服务来讲也是一个有用的指标。因为正在处理的任务数指标使用的是 Gauge,所以我们可以使用 deriv() 函数来计算每秒钟等待处理的任务数的变化速度。这个指标很有用,可以用来判断当前运行的 worker 处理当前的任务量是否足够。
sum by (type) (deriv(worker_jobs_inflight[5m]))
另一个 Prometheus 可以计算出的有用指标是一个 worker 处理它的任务所花费的平均时间。为此指标,我们需要使用 rate() 函数来比较处理任务所花费的秒数以及处理完成的任务数。
sum(
  rate(worker_jobs_process_time_seconds_sum[5m])
  /
  rate(worker_jobs_process_time_seconds_count[5m])
)
因为 worker_jobs_process_time_seconds 指标是一个 Histogram,我们可以使用 histogram_quantile()) 函数来显示一个 worker 处理分配给它的任务所耗时间的第 50, 95, 100 百分位数。这将让我们更好的看到不同 worker 处理任务所花时间的分布。注意 quantile 函数依赖 le 标签才能正常工作,且必须包含在 aggregation 里。(非常感谢 @jwenz723 提供这些查询示例!)
第 50 百分位数
histogram_quantile(
  0.5,
  sum by (worker, le) (rate(worker_jobs_process_time_seconds_bucket[5m]))
)
第 95 百分位数
histogram_quantile(
  0.95,
  sum by (worker, le) (rate(worker_jobs_process_time_seconds_bucket[5m]))
)
第 100 百分位数
histogram_quantile(
  1,
  sum by (worker, le) (rate(worker_jobs_process_time_seconds_bucket[5m]))
)
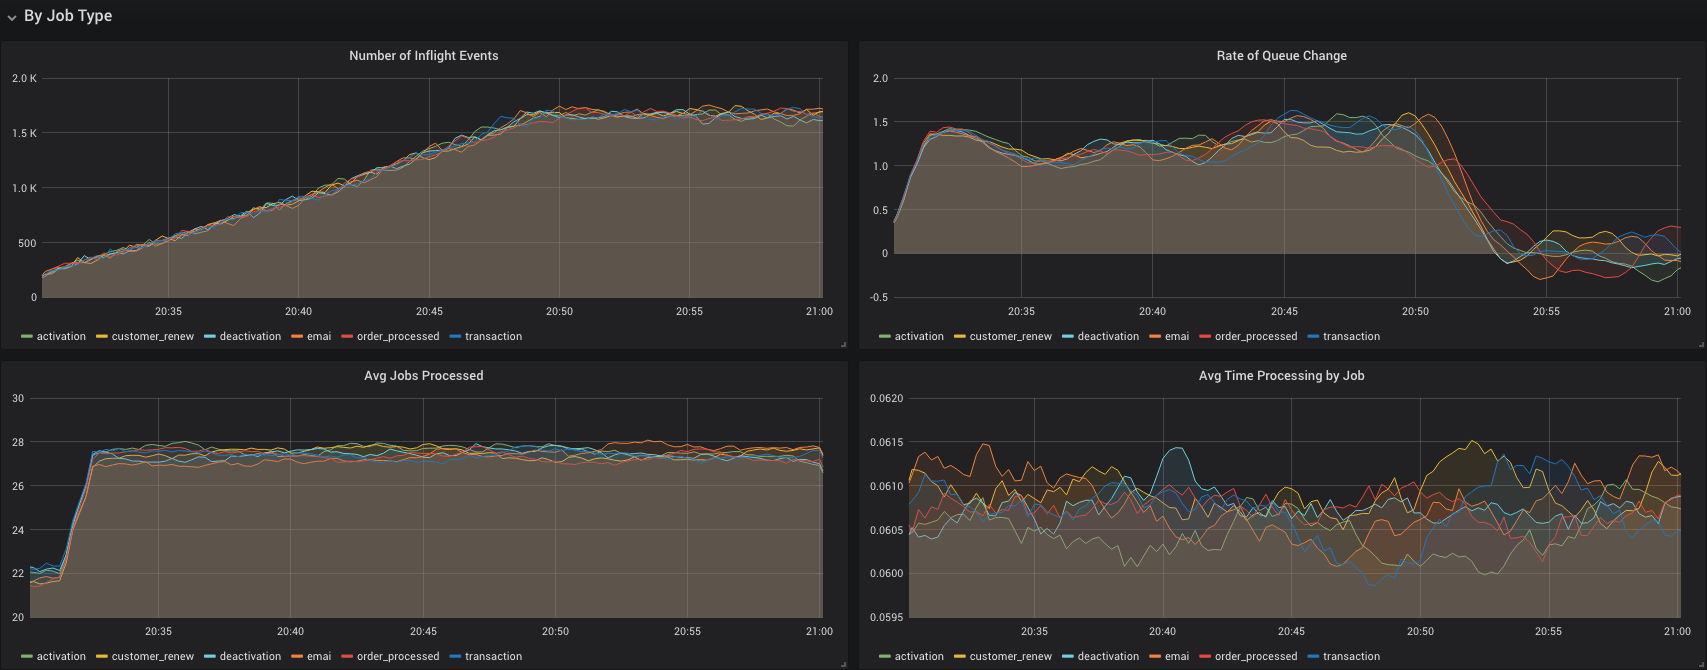
最后,我推荐配置 Grafana 来向你的 Prometheus 服务器查询指标。Grafana 是一个令人惊叹的开源可视化解决方案,它能帮助你把 Prometheus 统计数据变成漂亮的可操作的面板。这里有一些用这种方式创建出的面板。

查阅这个关于 向你的 Golang 服务添加 Prometheus 指标 的示例获得更多 Grafana 面板的例子。
Dec 17, 2018
via: https://scot.coffee/2018/12/monitoring-go-applications-with-prometheus/
作者:Scot Wells 译者:krystollia 校对:polaris1119
本文由 GCTT 原创翻译,Go语言中文网 首发。也想加入译者行列,为开源做一些自己的贡献么?欢迎加入 GCTT!
翻译工作和译文发表仅用于学习和交流目的,翻译工作遵照 CC-BY-NC-SA 协议规定,如果我们的工作有侵犯到您的权益,请及时联系我们。
欢迎遵照 CC-BY-NC-SA 协议规定 转载,敬请在正文中标注并保留原文/译文链接和作者/译者等信息。
文章仅代表作者的知识和看法,如有不同观点,请楼下排队吐槽
有疑问加站长微信联系(非本文作者))


