Vincent Blanchon
2019 年 9 月 19 日
“A Journey With Go” 专属插图,由 Renee French 根据原始 Go Gopher 制作。
ℹ️ 本文基于 Go 1.13.
go test 命令提供了许多出色的功能,比如代码覆盖率,CPU 和 内存分析。要提供这些统计信息,Go 就需要一种方式来跟踪 CPU 使用率,或在代码覆盖中跟踪一个函数何时被用到。
性能测量
Go 使用多种方式来产生这些统计信息:
- 动态插入性能测量语句,使其可以跟踪到代码何时进入一个函数或条件。这个策略在代码覆盖率中使用。
- 每秒记录多次程序样本。这个策略在CPU 分析中用到。
- 在代码中使用静态 hook,以便在执行期间调用所需函数。这个策略在内存分析中用到。
我们来写一个简单的程序并回顾所有内容。这是我们在后面的章节将使用的代码:
package main

import "math/rand"

func main() {
    println(run())
}

//go:noinline
func run() int {
    a := 0
    for i:= 0; i < rand.Intn(100000); i++ {
        if i % 2 == 0 {
            add(&a)
        } else {
            sub(&a)
        }
    }

    return a
}

//go:noinline
func add(a *int) {
    *a += rand.Intn(10)
}

//go:noinline
func sub(a *int) {
    *a -= rand.Intn(10)
}
main.go 托管在 [GitHub] (https://github.com/) 查看
代码覆盖率
通过 GOSSAFUNC=run Go test -cover 命令生成的 SSA 代码,我们可以查看 Go 对程序进行了什么样的修改:
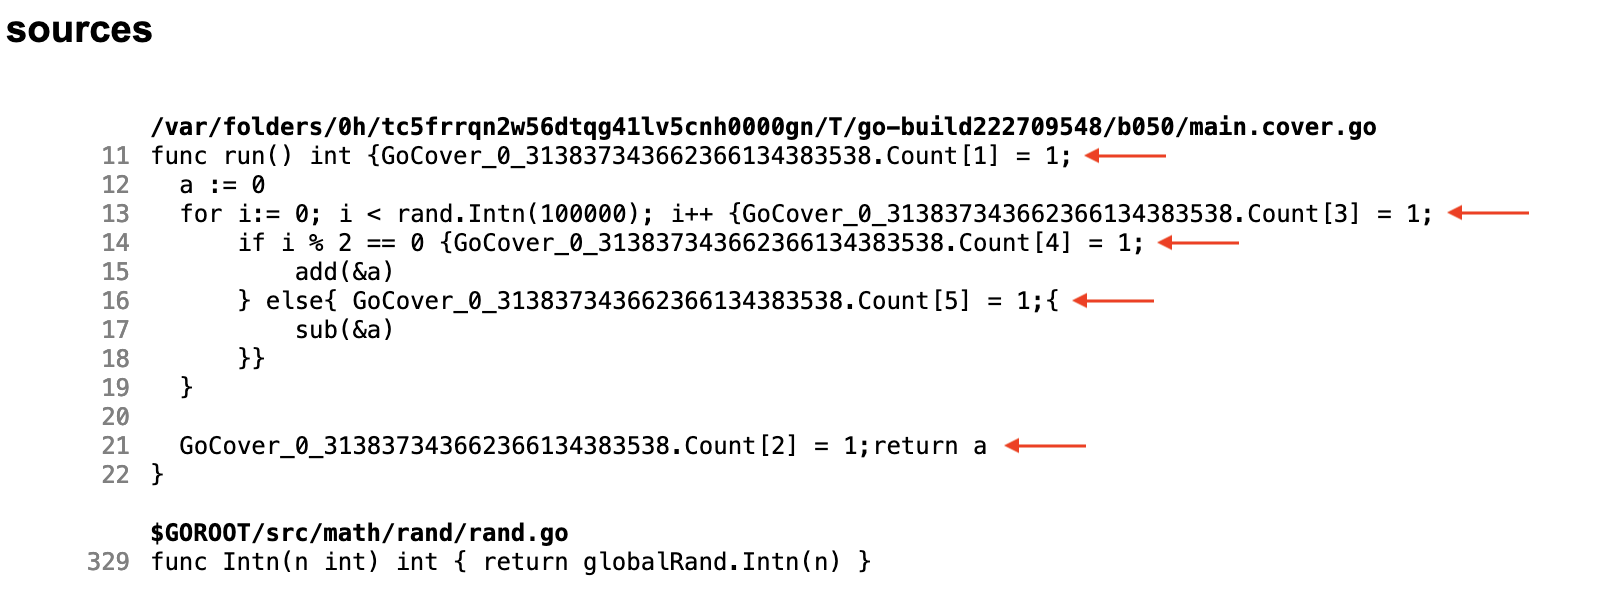
变量 GoCover_0_313837343662366134383538 是一个标志数组,其中每个键是一个代码块,当代码实际进入这一块时对应的标志设置为 1.
你可以在我的文章 “Go: Compiler Phases” 中找到更多关于 SSA 的信息。
生成的代码将稍后在管理代码覆盖率报告的函数中使用。 我们可以通过使用 objdump 命令反汇编代码覆盖期间生成的目标文件来进行验证。 运行 go test -cover -o main.o && Go tool objdump main.go 将反汇编代码并显示缺少的部分。 它首先初始化并在自动生成的 init 函数中注册 coverage:
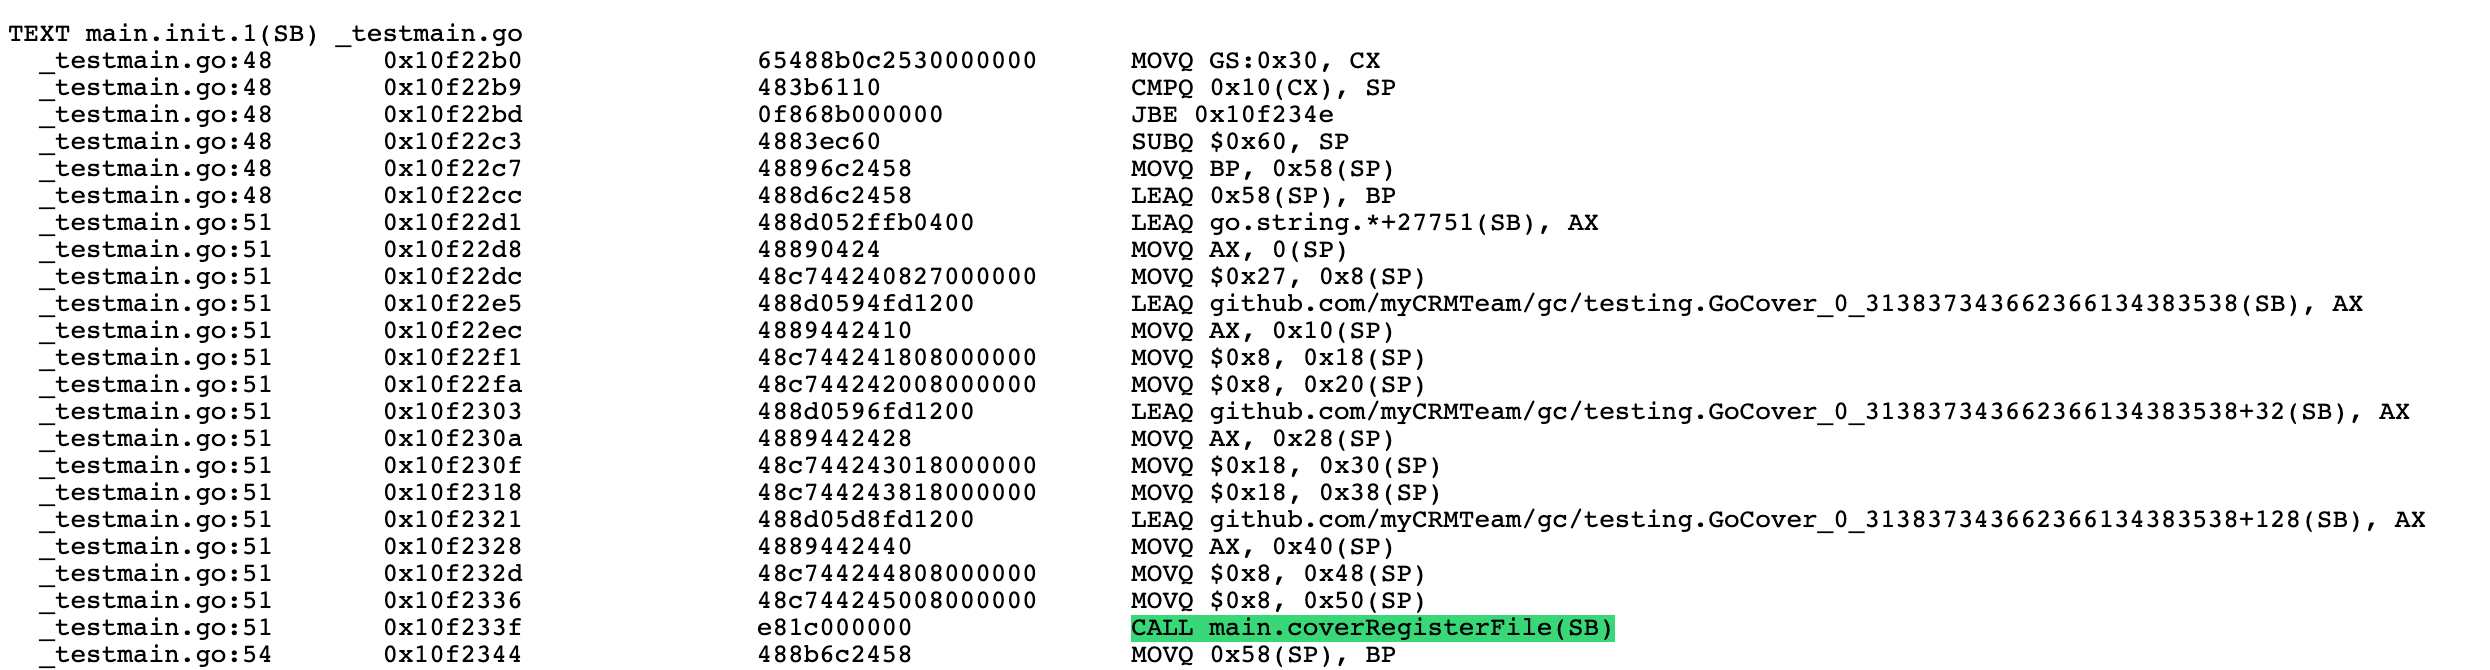 test.go 添加的 init 方法
然后,如前所述,测试将在执行期间收集覆盖率数据并且会触发一个方法来实际写入和显示覆盖率:
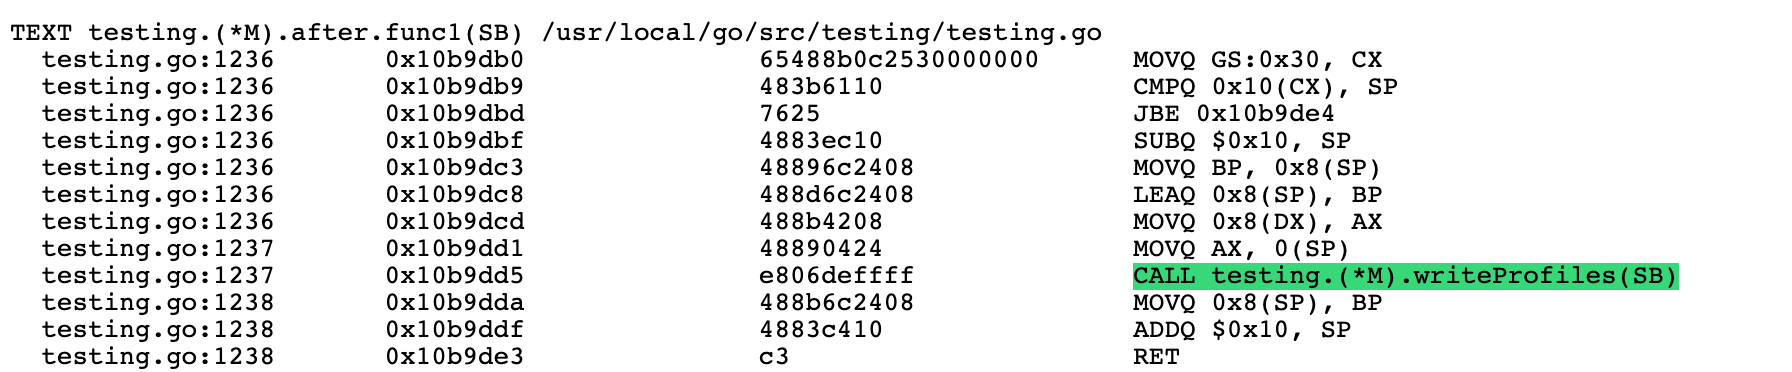 go test 调用的 after 函数
CPU 分析
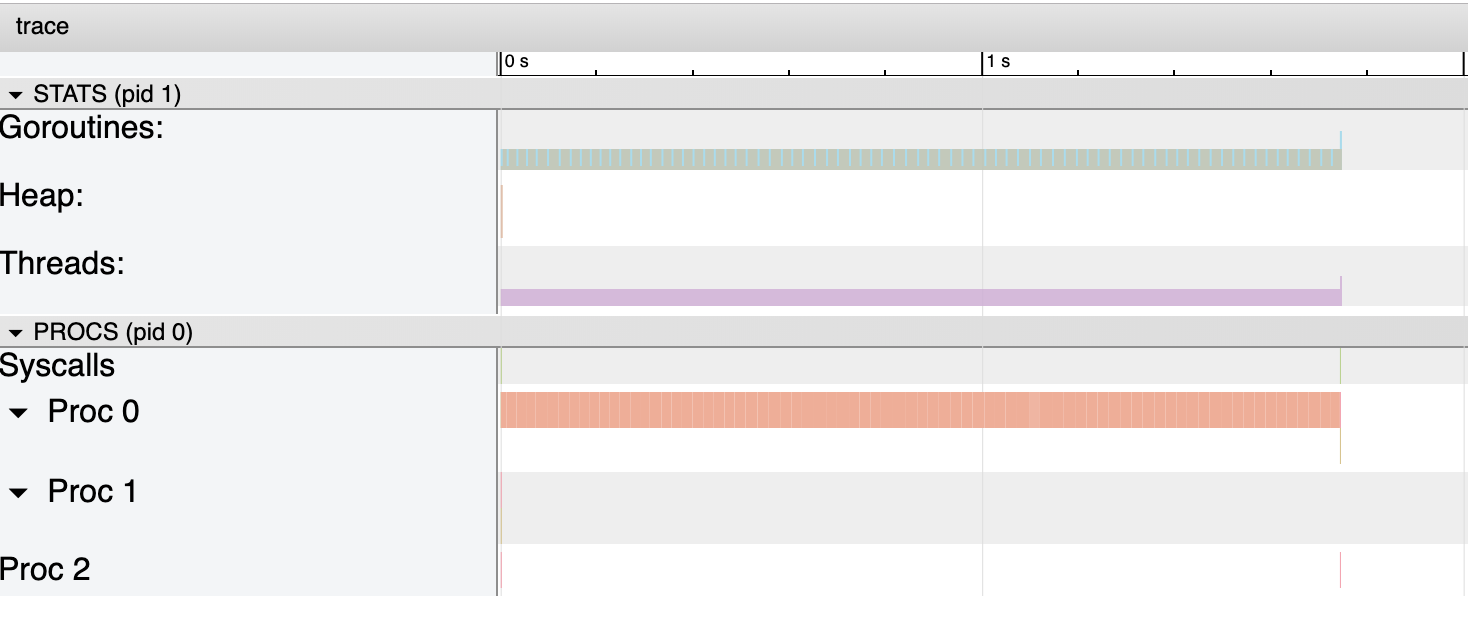
跟踪 CPU 使用率的策略则有所不同。Go 会停止程序并收集正在运行程序的样本。这里是未开启 CPU 分析的代码的 trace:
这里是相同代码开启了 CPU 分析的 trace:
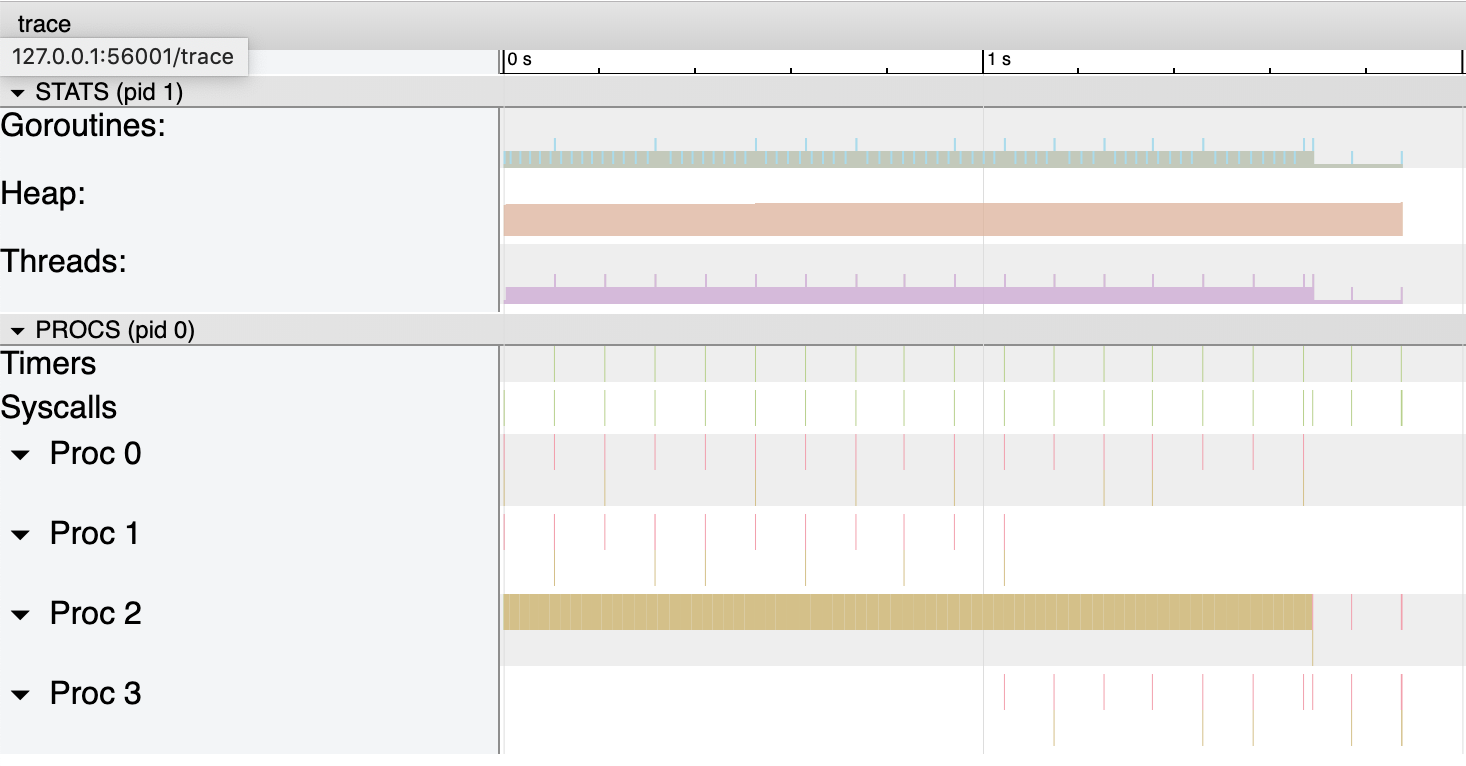
增加的 trace 与 pprof 及性能分析相关。这里是其中一个的放大图:
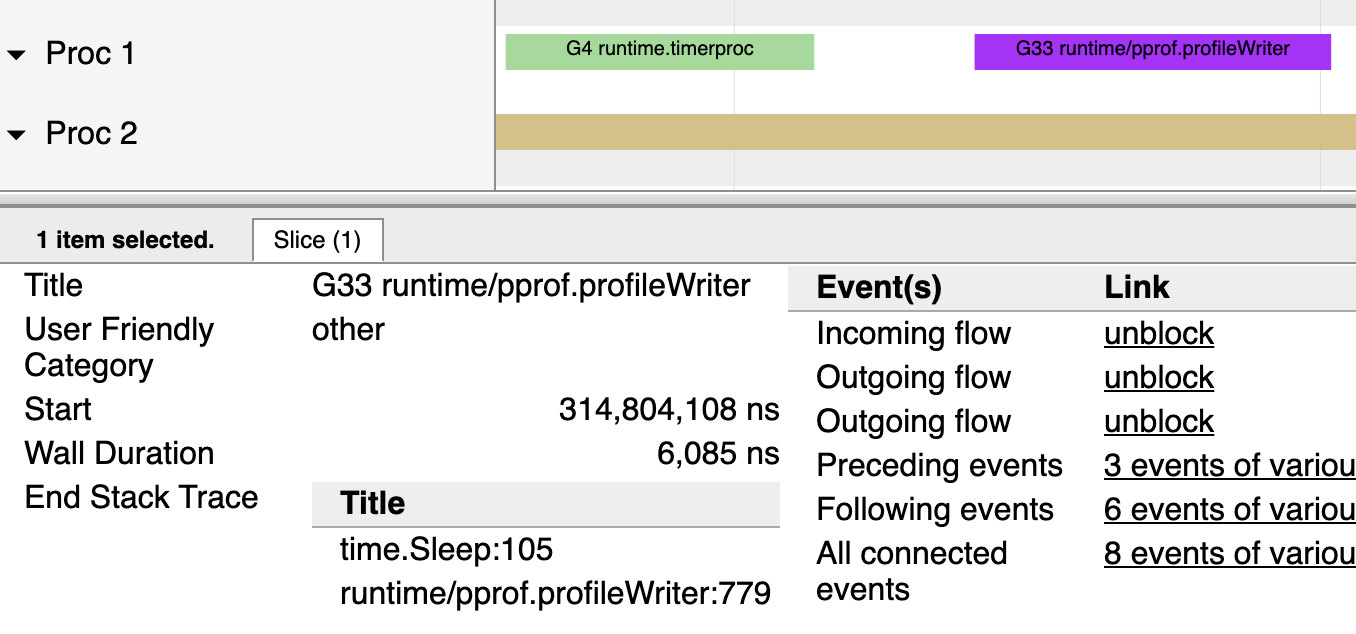
profileWriter 方法将循环调用,每 100 毫秒收集 CPU 数据,以在性能分析结束时最终生成报告。
内存分析
内存分析包含在源码中,并已集成在内存分配系统中。在使用 -memprofile 开启内存分析的情况下,位于 malloc.go 中的内存分配器,将对已分配的内存进行分析。这里,依然可以通过反汇编代码进行验证。这里是内存分配器的使用:

开启了内存分配分析
你可以在我的文章 “Go: Unknown Parts of the Test Package” 中找到更多关于 test 包的信息.
via: https://medium.com/a-journey-with-go/go-instrumentation-in-go-e845cdae0c51
作者:Vincent Blanchon 译者:krystollia 校对:polaris1119
本文由 GCTT 原创翻译,Go语言中文网 首发。也想加入译者行列,为开源做一些自己的贡献么?欢迎加入 GCTT!
翻译工作和译文发表仅用于学习和交流目的,翻译工作遵照 CC-BY-NC-SA 协议规定,如果我们的工作有侵犯到您的权益,请及时联系我们。
欢迎遵照 CC-BY-NC-SA 协议规定 转载,敬请在正文中标注并保留原文/译文链接和作者/译者等信息。
文章仅代表作者的知识和看法,如有不同观点,请楼下排队吐槽
有疑问加站长微信联系(非本文作者))