GoJS是一个JavaScript库,让你轻松创建现代Web浏览器的交互图。 GoJS支持图形化的模板和图形对象属性数据模型的数据绑定。你只需要保存和恢复模型,包括持有任何性质的应用需求,简单的JavaScript对象。许多预定义的工具和命令执行,大部分的图表所需要的标准的行为。外观和行为的定制是大多设置属性的问题。
下载地址:http://gojs.net/latest/doc/download.html
使用gojs开发的流程图及拓扑图实例:http://gojs.net/latest/samples/index.html
goJS去水印版:http://download.csdn.net/detail/qq_14966339/9569675
goJS实例演示:
function init() {
    if (window.goSamples) goSamples();  // init for these samples -- you don't need to call this
    var $ = go.GraphObject.make;  // for conciseness in defining templates

    myDiagram =
      $(go.Diagram, "myDiagramDiv",  // must name or refer to the DIV HTML element
        {
          initialContentAlignment: go.Spot.Center,
          allowDrop: true,  // must be true to accept drops from the Palette
          "LinkDrawn": showLinkLabel,  // this DiagramEvent listener is defined below
          "LinkRelinked": showLinkLabel,
          "animationManager.duration": 800, // slightly longer than default (600ms) animation
          "undoManager.isEnabled": true  // enable undo & redo
        });

    // when the document is modified, add a "*" to the title and enable the "Save" button
    myDiagram.addDiagramListener("Modified", function(e) {
      var button = document.getElementById("SaveButton");
      if (button) button.disabled = !myDiagram.isModified;
      var idx = document.title.indexOf("*");
      if (myDiagram.isModified) {
        if (idx < 0) document.title += "*";
      } else {
        if (idx >= 0) document.title = document.title.substr(0, idx);
      }
    });

    // helper definitions for node templates

    function nodeStyle() {
      return [
        // The Node.location comes from the "loc" property of the node data,
        // converted by the Point.parse static method.
        // If the Node.location is changed, it updates the "loc" property of the node data,
        // converting back using the Point.stringify static method.
        new go.Binding("location", "loc", go.Point.parse).makeTwoWay(go.Point.stringify),
        {
          // the Node.location is at the center of each node
          locationSpot: go.Spot.Center,
          //isShadowed: true,
          //shadowColor: "#888",
          // handle mouse enter/leave events to show/hide the ports
          mouseEnter: function (e, obj) { showPorts(obj.part, true); },
          mouseLeave: function (e, obj) { showPorts(obj.part, false); }
        }
      ];
    }

    // Define a function for creating a "port" that is normally transparent.
    // The "name" is used as the GraphObject.portId, the "spot" is used to control how links connect
    // and where the port is positioned on the node, and the boolean "output" and "input" arguments
    // control whether the user can draw links from or to the port.
    function makePort(name, spot, output, input) {
      // the port is basically just a small circle that has a white stroke when it is made visible
      return $(go.Shape, "Circle",
               {
                  fill: "transparent",
                  stroke: null,  // this is changed to "white" in the showPorts function
                  desiredSize: new go.Size(8, 8),
                  alignment: spot, alignmentFocus: spot,  // align the port on the main Shape
                  portId: name,  // declare this object to be a "port"
                  fromSpot: spot, toSpot: spot,  // declare where links may connect at this port
                  fromLinkable: output, toLinkable: input,  // declare whether the user may draw links to/from here
                  cursor: "pointer"  // show a different cursor to indicate potential link point
               });
    }

    // define the Node templates for regular nodes

    var lightText = 'whitesmoke';

    myDiagram.nodeTemplateMap.add("",  // the default category
      $(go.Node, "Spot", nodeStyle(),
        // the main object is a Panel that surrounds a TextBlock with a rectangular Shape
        $(go.Panel, "Auto",
          $(go.Shape, "Rectangle",
            { fill: "#00A9C9", stroke: null },
            new go.Binding("figure", "figure")),
          $(go.TextBlock,
            {
              font: "bold 11pt Helvetica, Arial, sans-serif",
              stroke: lightText,
              margin: 8,
              maxSize: new go.Size(160, NaN),
              wrap: go.TextBlock.WrapFit,
              editable: true
            },
            new go.Binding("text").makeTwoWay())
        ),
        // four named ports, one on each side:
        makePort("T", go.Spot.Top, false, true),
        makePort("L", go.Spot.Left, true, true),
        makePort("R", go.Spot.Right, true, true),
        makePort("B", go.Spot.Bottom, true, false)
      ));

    myDiagram.nodeTemplateMap.add("Start",
      $(go.Node, "Spot", nodeStyle(),
        $(go.Panel, "Auto",
          $(go.Shape, "Circle",
            { minSize: new go.Size(40, 40), fill: "#79C900", stroke: null }),
          $(go.TextBlock, "Start",
            { font: "bold 11pt Helvetica, Arial, sans-serif", stroke: lightText },
            new go.Binding("text"))
        ),
        // three named ports, one on each side except the top, all output only:
        makePort("L", go.Spot.Left, true, false),
        makePort("R", go.Spot.Right, true, false),
        makePort("B", go.Spot.Bottom, true, false)
      ));

    myDiagram.nodeTemplateMap.add("End",
      $(go.Node, "Spot", nodeStyle(),
        $(go.Panel, "Auto",
          $(go.Shape, "Circle",
            { minSize: new go.Size(40, 40), fill: "#DC3C00", stroke: null }),
          $(go.TextBlock, "End",
            { font: "bold 11pt Helvetica, Arial, sans-serif", stroke: lightText },
            new go.Binding("text"))
        ),
        // three named ports, one on each side except the bottom, all input only:
        makePort("T", go.Spot.Top, false, true),
        makePort("L", go.Spot.Left, false, true),
        makePort("R", go.Spot.Right, false, true)
      ));

    myDiagram.nodeTemplateMap.add("Comment",
      $(go.Node, "Auto", nodeStyle(),
        $(go.Shape, "File",
          { fill: "#EFFAB4", stroke: null }),
        $(go.TextBlock,
          {
            margin: 5,
            maxSize: new go.Size(200, NaN),
            wrap: go.TextBlock.WrapFit,
            textAlign: "center",
            editable: true,
            font: "bold 12pt Helvetica, Arial, sans-serif",
            stroke: '#454545'
          },
          new go.Binding("text").makeTwoWay())
        // no ports, because no links are allowed to connect with a comment
      ));


    // replace the default Link template in the linkTemplateMap
    myDiagram.linkTemplate =
      $(go.Link,  // the whole link panel
        {
          routing: go.Link.AvoidsNodes,
          curve: go.Link.JumpOver,
          corner: 5, toShortLength: 4,
          relinkableFrom: true,
          relinkableTo: true,
          reshapable: true,
          resegmentable: true,
          // mouse-overs subtly highlight links:
          mouseEnter: function(e, link) { link.findObject("HIGHLIGHT").stroke = "rgba(30,144,255,0.2)"; },
          mouseLeave: function(e, link) { link.findObject("HIGHLIGHT").stroke = "transparent"; }
        },
        new go.Binding("points").makeTwoWay(),
        $(go.Shape,  // the highlight shape, normally transparent
          { isPanelMain: true, strokeWidth: 8, stroke: "transparent", name: "HIGHLIGHT" }),
        $(go.Shape,  // the link path shape
          { isPanelMain: true, stroke: "gray", strokeWidth: 2 }),
        $(go.Shape,  // the arrowhead
          { toArrow: "standard", stroke: null, fill: "gray"}),
        $(go.Panel, "Auto",  // the link label, normally not visible
          { visible: false, name: "LABEL", segmentIndex: 2, segmentFraction: 0.5},
          new go.Binding("visible", "visible").makeTwoWay(),
          $(go.Shape, "RoundedRectangle",  // the label shape
            { fill: "#F8F8F8", stroke: null }),
          $(go.TextBlock, "Yes",  // the label
            {
              textAlign: "center",
              font: "10pt helvetica, arial, sans-serif",
              stroke: "#333333",
              editable: true
            },
            new go.Binding("text").makeTwoWay())
        )
      );

    // Make link labels visible if coming out of a "conditional" node.
    // This listener is called by the "LinkDrawn" and "LinkRelinked" DiagramEvents.
    function showLinkLabel(e) {
      var label = e.subject.findObject("LABEL");
      if (label !== null) label.visible = (e.subject.fromNode.data.figure === "Diamond");
    }

    // temporary links used by LinkingTool and RelinkingTool are also orthogonal:
    myDiagram.toolManager.linkingTool.temporaryLink.routing = go.Link.Orthogonal;
    myDiagram.toolManager.relinkingTool.temporaryLink.routing = go.Link.Orthogonal;

    load();  // load an initial diagram from some JSON text

    // initialize the Palette that is on the left side of the page
    myPalette =
      $(go.Palette, "myPaletteDiv",  // must name or refer to the DIV HTML element
        {
          "animationManager.duration": 800, // slightly longer than default (600ms) animation
          nodeTemplateMap: myDiagram.nodeTemplateMap,  // share the templates used by myDiagram
          model: new go.GraphLinksModel([  // specify the contents of the Palette
            { category: "Start", text: "Start" },
            { text: "Step" },
            { text: "???", figure: "Diamond" },
            { category: "End", text: "End" },
            { category: "Comment", text: "Comment" }
          ])
        });

    // The following code overrides GoJS focus to stop the browser from scrolling
    // the page when either the Diagram or Palette are clicked or dragged onto.

    function customFocus() {
      var x = window.scrollX || window.pageXOffset;
      var y = window.scrollY || window.pageYOffset;
      go.Diagram.prototype.doFocus.call(this);
      window.scrollTo(x, y);
    }

    myDiagram.doFocus = customFocus;
    myPalette.doFocus = customFocus;


  } // end init

  // Make all ports on a node visible when the mouse is over the node
  function showPorts(node, show) {
    var diagram = node.diagram;
    if (!diagram || diagram.isReadOnly || !diagram.allowLink) return;
    node.ports.each(function(port) {
        port.stroke = (show ? "white" : null);
      });
  }


  // Show the diagram's model in JSON format that the user may edit
  function save() {
    document.getElementById("mySavedModel").value = myDiagram.model.toJson();
    myDiagram.isModified = false;
  }
  function load() {
    myDiagram.model = go.Model.fromJson(document.getElementById("mySavedModel").value);
  }

  // add an SVG rendering of the diagram at the end of this page
  function makeSVG() {
    var svg = myDiagram.makeSvg({
        scale: 0.5
      });
    svg.style.border = "1px solid black";
    obj = document.getElementById("SVGArea");
    obj.appendChild(svg);
    if (obj.children.length > 0) {
      obj.replaceChild(svg, obj.children[0]);
    }
  }

<div id="sample">
  <div style="width:100%; white-space:nowrap;">
    <span style="display: inline-block; vertical-align: top; width:100px">
      <div id="myPaletteDiv" style="border: solid 1px black; height: 720px"></div>
    </span>

    <span style="display: inline-block; vertical-align: top; width:80%">
      <div id="myDiagramDiv" style="border: solid 1px black; height: 720px"></div>
    </span>
  </div>
  <p>
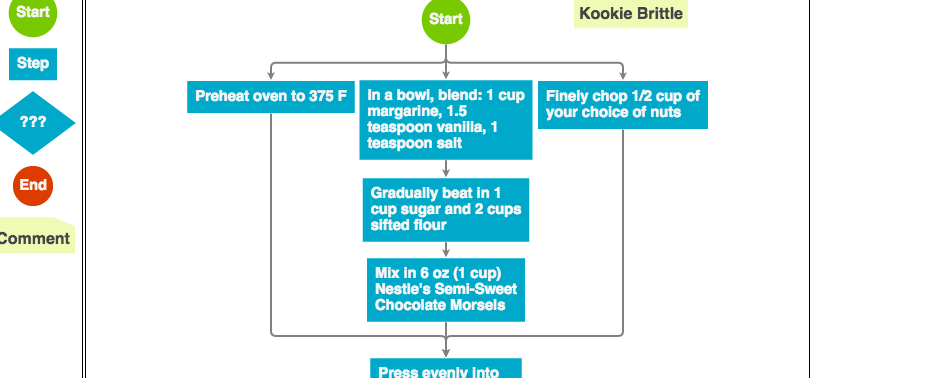
  The FlowChart sample demonstrates several key features of GoJS,
  namely <a href="../intro/palette.html">Palette</a>s,
  <a href="../intro/links.html">Linkable nodes</a>, Drag/Drop behavior,
  <a href="../intro/textBlocks.html">Text Editing</a>, and the use of
  <a href="../intro/templateMaps.html">Node Template Maps</a> in Diagrams.
  </p>
  <p>
  Mouse-over a Node to view its ports.
  Drag from these ports to create new Links.
  Selecting Links allows you to re-shape and re-link them.
  Selecting a Node and then clicking its TextBlock will allow
  you to edit text (except on the Start and End Nodes).
  </p>
  <button id="SaveButton" onclick="save()">Save</button>
  <button onclick="load()">Load</button>
  Diagram Model saved in JSON format:
  <textarea id="mySavedModel" style="width:100%;height:300px">{ "class": "go.GraphLinksModel",
  "linkFromPortIdProperty": "fromPort",
  "linkToPortIdProperty": "toPort",
  "nodeDataArray": [
{"category":"Comment", "loc":"360 -10", "text":"Kookie Brittle", "key":-13},
{"key":-1, "category":"Start", "loc":"175 0", "text":"Start"},
{"key":0, "loc":"0 77", "text":"Preheat oven to 375 F"},
{"key":1, "loc":"175 100", "text":"In a bowl, blend: 1 cup margarine, 1.5 teaspoon vanilla, 1 teaspoon salt"},
{"key":2, "loc":"175 190", "text":"Gradually beat in 1 cup sugar and 2 cups sifted flour"},
{"key":3, "loc":"175 270", "text":"Mix in 6 oz (1 cup) Nestle's Semi-Sweet Chocolate Morsels"},
{"key":4, "loc":"175 370", "text":"Press evenly into ungreased 15x10x1 pan"},
{"key":5, "loc":"352 85", "text":"Finely chop 1/2 cup of your choice of nuts"},
{"key":6, "loc":"175 440", "text":"Sprinkle nuts on top"},
{"key":7, "loc":"175 500", "text":"Bake for 25 minutes and let cool"},
{"key":8, "loc":"175 570", "text":"Cut into rectangular grid"},
{"key":-2, "category":"End", "loc":"175 640", "text":"Enjoy!"}
 ],
  "linkDataArray": [
{"from":1, "to":2, "fromPort":"B", "toPort":"T"},
{"from":2, "to":3, "fromPort":"B", "toPort":"T"},
{"from":3, "to":4, "fromPort":"B", "toPort":"T"},
{"from":4, "to":6, "fromPort":"B", "toPort":"T"},
{"from":6, "to":7, "fromPort":"B", "toPort":"T"},
{"from":7, "to":8, "fromPort":"B", "toPort":"T"},
{"from":8, "to":-2, "fromPort":"B", "toPort":"T"},
{"from":-1, "to":0, "fromPort":"B", "toPort":"T"},
{"from":-1, "to":1, "fromPort":"B", "toPort":"T"},
{"from":-1, "to":5, "fromPort":"B", "toPort":"T"},
{"from":5, "to":4, "fromPort":"B", "toPort":"T"},
{"from":0, "to":4, "fromPort":"B", "toPort":"T"}
 ]}
  </textarea>
  <p>Click the button below to render the current GoJS Diagram into SVG at one-half scale.
     The SVG is not interactive like the GoJS diagram, but can be used for printing or display.
     For more information, see the page on <a href="../intro/makingSVG.html">making SVG</a>.</p>
  <button onclick="makeSVG()">Render as SVG</button>
  <div id="SVGArea"></div>
</div>
效果图:

有疑问加站长微信联系(非本文作者)


